
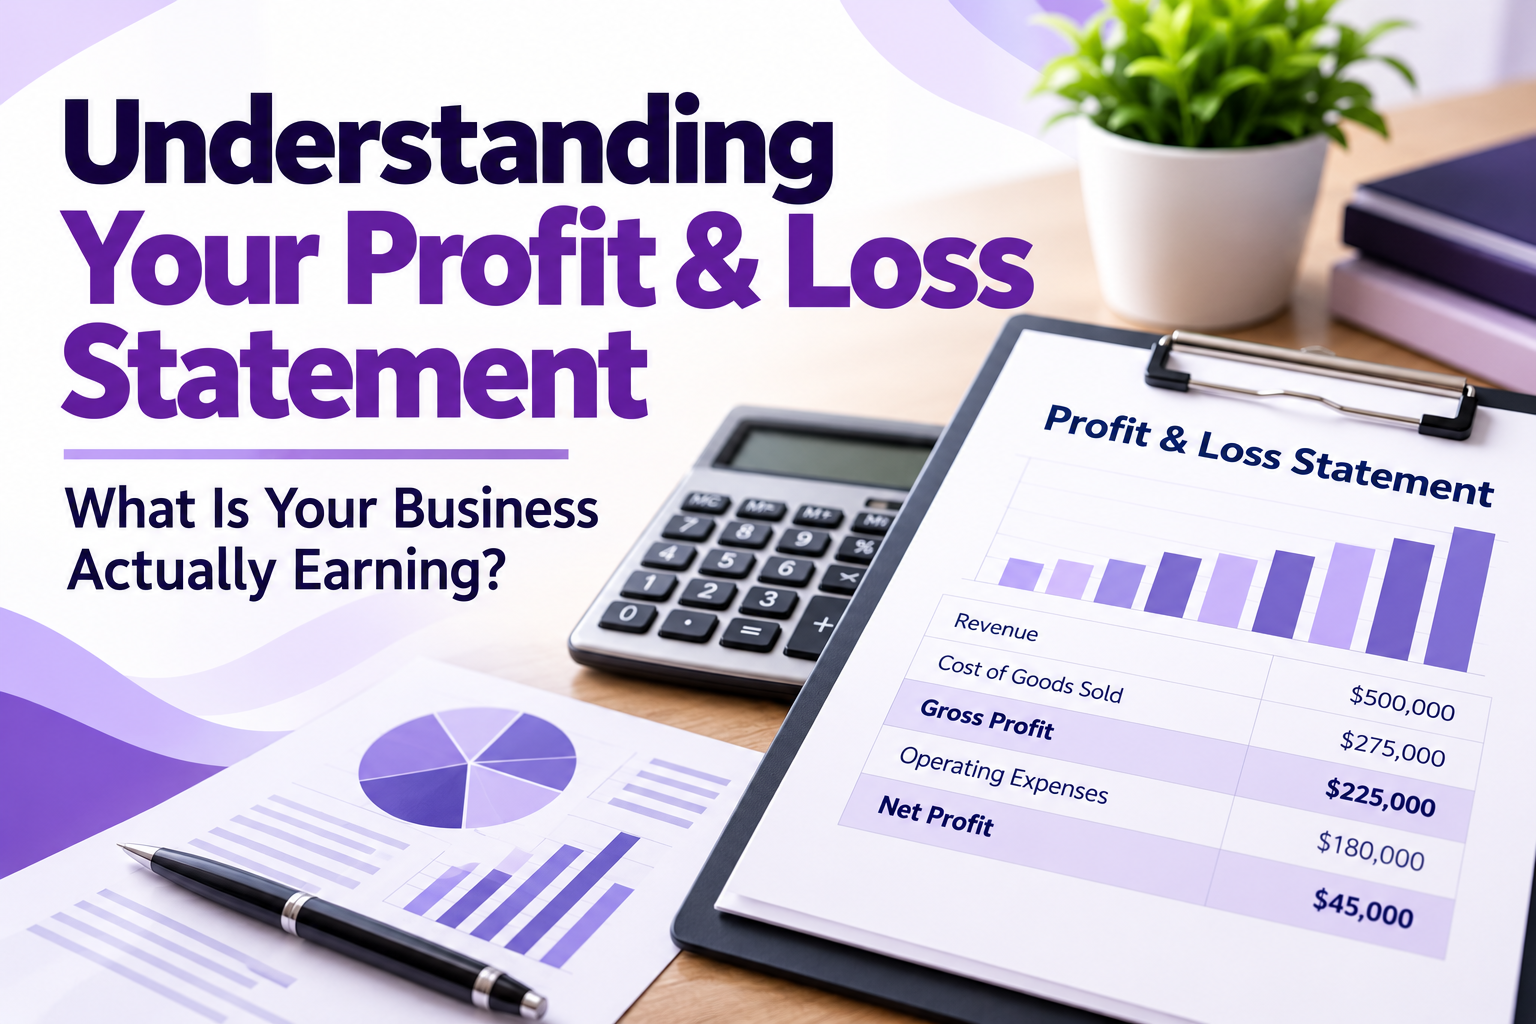
Understanding Your Profit & Loss Statement: What Is Your Business Actually Earning?
One of the most important questions every business owner should be able to answer is:
“Is my business actually making money?”
Looking at the balance in your business bank account may seem like an easy way to answer that question.
But your bank balance does not necessarily tell you whether your business is profitable.
A business can have significant cash in the bank and still be losing money. Another business can be profitable while experiencing serious cash-flow problems.
To understand what your business is actually earning, one of the first financial statements you should review is the Profit & Loss Statement, also commonly called the Income Statement.
What Is a Profit & Loss Statement?
A Profit & Loss Statement summarizes the revenue earned and expenses incurred by a business during a specific period.
That period might be:
- One month
- One quarter
- Year-to-date
- One year
- Another reporting period
At its simplest:
Revenue − Expenses = Profit or Loss
But a useful P&L provides much more information than one final profit number.
It can help business owners understand:
Revenue → Cost of Sales → Gross Profit → Operating Expenses → Net Profit
Each section tells a different part of the financial story.
A Simple Example
Suppose ABC Services has the following annual results:
Revenue: $300,000
Cost of Goods Sold: $90,000
Gross Profit: $210,000
Operating Expenses: $150,000
Net Profit: $60,000
At first glance, the business generated $300,000 in sales.
But the owner did not actually earn $300,000.
After considering the costs associated with generating those sales and operating the business, the company produced $60,000 of net profit.
This illustrates an important principle:
Revenue is not profit.
1. Revenue: What Did the Business Earn?
Revenue generally represents income generated from the company's normal business activities.
Depending on the business, revenue might include:
- Product sales
- Service revenue
- Consulting fees
- Contract revenue
- Subscription revenue
- Other operating income
Suppose a company reports:
Annual Revenue: $500,000
That number tells us how much revenue the business generated.
But it does not tell us how profitable the business was.
If the company incurred $490,000 of costs and expenses, the financial picture is very different from a company generating the same $500,000 of revenue with only $300,000 of costs and expenses.
This is why business owners should avoid judging performance based only on sales.
High revenue does not automatically mean high profitability.
2. Cost of Goods Sold: What Did It Cost to Generate the Sales?
For businesses that sell products or have direct costs associated with generating revenue, the P&L may include Cost of Goods Sold (COGS) or Cost of Sales.
Examples may include:
- Inventory sold
- Materials
- Direct production costs
- Certain direct labor
- Other costs directly connected with producing goods or services
Consider a retail business with:
Sales: $400,000
Cost of Goods Sold: $260,000
The company did not make $400,000 from selling its products.
Before considering rent, payroll, insurance, advertising, utilities, and other operating expenses, $260,000 was already consumed by the cost of the products sold.
That leaves:
Gross Profit: $140,000
3. Gross Profit: What Remains After Direct Costs?
Gross profit is generally calculated as:
Revenue − Cost of Goods Sold = Gross Profit
Using the previous example:
Revenue: $400,000
COGS: $260,000
Gross Profit:
$400,000 − $260,000 = $140,000
Gross profit is an important number because it shows how much remains after the direct cost of generating sales.
That remaining amount must then support the company's operating expenses.
4. Gross Profit Margin
Business owners should not look only at gross profit dollars.
They should also understand the gross profit margin.
The basic calculation is:
Gross Profit ÷ Revenue × 100
Using the previous example:
Gross Profit: $140,000
Revenue: $400,000
$140,000 ÷ $400,000 = 35%
The company's gross profit margin is:
35%
This means that for every $1.00 of revenue, approximately $0.35 remains after the cost of goods sold, before considering operating expenses.
Monitoring gross margin over time can help identify changes in:
- Pricing
- Product costs
- Purchasing
- Discounts
- Sales mix
- Production efficiency
- Other direct costs
A declining gross margin may deserve attention even when total revenue is increasing.
5. Operating Expenses: What Does It Cost to Run the Business?
After gross profit, the P&L generally reports operating expenses.
These are costs associated with operating the company.
Depending on the business, they might include:
- Wages and salaries
- Payroll taxes
- Rent
- Utilities
- Insurance
- Advertising and marketing
- Software
- Professional fees
- Office expenses
- Repairs and maintenance
- Vehicle expenses
- Depreciation
- Bank and merchant fees
- Other business expenses
Suppose the company has:
Gross Profit: $140,000
Operating Expenses: $105,000
That leaves:
Operating Profit: $35,000
This tells a very different story than simply saying:
“The business had $400,000 in sales.”
6. Net Profit: What Did the Business Actually Earn?
After applicable expenses are considered, the P&L eventually arrives at the company's net income or net profit.
Suppose a business reports:
Revenue: $500,000
Cost of Goods Sold: $275,000
Gross Profit: $225,000
Operating and other expenses: $180,000
Net Profit:
$45,000
The company generated half a million dollars in revenue.
But its profit was only $45,000.
The difference is significant.
This is why business owners should understand:
Sales → Gross Profit → Operating Profit → Net Profit
Rather than focusing only on revenue.
7. Net Profit Margin
Net profit can also be evaluated as a percentage of revenue.
The basic calculation is:
Net Profit ÷ Revenue × 100
Using the previous example:
Net Profit: $45,000
Revenue: $500,000
$45,000 ÷ $500,000 = 9%
Net Profit Margin:
9%
This means that approximately $0.09 of every $1.00 of revenue remained as net profit after the expenses reflected in this simplified example.
Looking at profit as a percentage can make it easier to compare financial performance across different periods.
8. Revenue Growth Does Not Always Mean Profit Growth
Suppose a business reports:
Year 1
Revenue: $300,000
Net Profit: $45,000
Net Margin: 15%
Year 2
Revenue: $400,000
Net Profit: $40,000
Net Margin: 10%
Revenue increased by $100,000.
At first glance, the company appears to have grown substantially.
But net profit actually declined by $5,000.
The business worked through significantly more sales but retained less profit.
This could happen because:
- Product costs increased
- Payroll increased
- Pricing did not keep pace with costs
- Operating expenses increased
- Discounts increased
- The sales mix changed
- The business became less efficient
Growth should therefore be measured by more than revenue.
9. Profit Is Not the Same as Cash
Another important concept is:
Profit does not necessarily equal cash in the bank.
Suppose a company reports:
Revenue: $250,000
Expenses: $190,000
Net Profit: $60,000
That does not necessarily mean the company's bank account increased by $60,000.
Cash could have been used for:
- Loan principal payments
- Equipment purchases
- Inventory
- Owner distributions or draws
- Accounts payable
- Tax payments
- Other balance-sheet transactions
Likewise, a business could receive loan proceeds that increase its bank balance without increasing its profit.
This is why:
Profitability and cash flow are related, but they are not the same thing.
10. Owner Withdrawals Can Create Confusion
Suppose a sole proprietor generates:
Revenue: $200,000
Business Expenses: $140,000
Net Profit: $60,000
During the year, the owner withdraws $45,000 for personal use.
That does not necessarily reduce business profit to $15,000.
The business still generated $60,000 of profit.
The $45,000 withdrawal generally represents an owner's draw rather than an operating expense.
This distinction is important when reviewing a P&L.
If owner withdrawals are incorrectly classified as expenses, the P&L may understate the company's profitability.
11. A P&L Is Only as Reliable as the Accounting Behind It
A professionally formatted financial statement is not automatically an accurate financial statement.
If transactions are incorrectly recorded, the P&L can provide misleading information.
Common problems include:
- Personal expenses recorded as business expenses
- Owner draws recorded as operating expenses
- Loan proceeds recorded as revenue
- Loan principal recorded as an expense
- Equipment purchases incorrectly expensed
- Revenue recorded in incorrect accounts
- Duplicate transactions
- Missing expenses
- Incorrect inventory accounting
- Incorrect cost-of-goods-sold classification
- Unreconciled bank accounts
- Uncategorized transactions
This leads to an important principle:
Good financial analysis begins with accurate bookkeeping.
12. Do Not Review Only the Bottom Line
Net profit is important, but business owners should review the entire P&L.
Consider these questions:
Revenue
Is revenue increasing or decreasing?
Gross Profit
Is the business retaining enough after direct costs?
Gross Margin
Is the margin improving or declining?
Operating Expenses
Which expenses are increasing?
Net Profit
Is the business actually profitable?
Net Margin
How much profit remains from each dollar of revenue?
The answers provide much more information than simply looking at the final number.
13. Compare Financial Performance Over Time
A P&L becomes more useful when periods are compared.
For example:
| Year 1 | Year 2 | |
|---|---|---|
| Revenue | $400,000 | $475,000 |
| Gross Profit | $160,000 | $180,000 |
| Operating Expenses | $120,000 | $145,000 |
| Net Profit | $40,000 | $35,000 |
Revenue increased.
Gross profit increased.
But operating expenses increased enough that net profit declined.
Without comparing the numbers, the owner might simply see higher sales and assume the company performed better.
Financial analysis tells a more complete story.
14. Questions Business Owners Should Ask Every Month
Rather than reviewing financial statements only during tax season, business owners should consider reviewing their P&L regularly.
Useful questions include:
- How much revenue did we generate?
- How does that compare with last month?
- How does it compare with the same period last year?
- What is our gross profit?
- What is our gross margin?
- Which expenses increased?
- Why did those expenses increase?
- What is our net profit?
- What is our net profit margin?
- Are we becoming more or less profitable?
- Are there unusual transactions?
- Are the books fully reconciled?
- What financial decisions should we make based on these numbers?
This changes accounting from simply recording history into a management tool.
15. Turn the P&L Into a Decision-Making Tool
A Profit & Loss Statement should not exist only for the accountant or tax preparer.
Business owners can use it when making decisions about:
Pricing
Are prices high enough to support costs and desired margins?
Expenses
Which costs are increasing faster than revenue?
Hiring
Can the business financially support another employee?
Marketing
Is increased spending contributing to profitable growth?
Expansion
Does the company generate enough sustainable profit to support growth?
Owner Compensation
How much can the business responsibly pay or distribute while maintaining sufficient financial resources?
The P&L becomes much more valuable when the numbers lead to decisions.
The Bigger Financial Picture
Understanding a Profit & Loss Statement is one part of understanding the financial condition of a business.
The P&L tells you about financial performance over a period of time.
But it does not tell the entire story.
Business owners should eventually understand how the three primary financial statements work together:
Profit & Loss Statement → Balance Sheet → Cash Flow Statement
Together, these statements help answer three different questions:
Is the business profitable?
What does the business own and owe?
Where is the cash coming from and where is it going?
Understanding these relationships allows business owners to move beyond simply tracking transactions.
Final Takeaway
A Profit & Loss Statement is more than a report showing revenue and expenses.
It helps business owners understand how their company actually performs.
Do not look only at sales.
Understand gross profit.
Monitor margins.
Review operating expenses.
Measure net profitability.
Compare results over time.
And make sure the accounting behind the report is accurate.
The goal should not simply be to generate financial statements.
The goal should be to understand what the financial statements are telling you about your business.
At RR Capital, LLC, our approach is to help business owners understand not only what their numbers are, but also what those numbers mean for the decisions they make.
Record → Report → Analyze → Understand → Decide
RR Capital, LLC
Accounting • Tax • Financial Advisory • Business Education
Understand Your Numbers. Strengthen Your Business.
Disclaimer
This material is provided for general educational and informational purposes only and does not constitute individualized accounting, tax, legal, investment, or financial advice. Financial statement presentation and accounting treatment can vary depending on the nature of the business, accounting method, entity structure, applicable accounting standards, tax rules, and individual circumstances. Business owners should consult qualified accounting, tax, and other professional advisors regarding their specific situation.